The CBOE Volatility Index, known by its ticker symbol VIX, is a popular measure of the stock market’s expectation of volatility implied by the S&P 500 index options, calculated and published by the Chicago Board Options Exchange (CBOE). It is colloquially referred to as the fear index or the fear gauge.
A high VIX readings mean investors see significant risk that the market will move sharply, whether downward or upward. The highest VIX readings occur when investors anticipate that huge moves in either direction are likely. Only when investors perceive neither significant downside risk nor significant upside potential will the VIX be low.
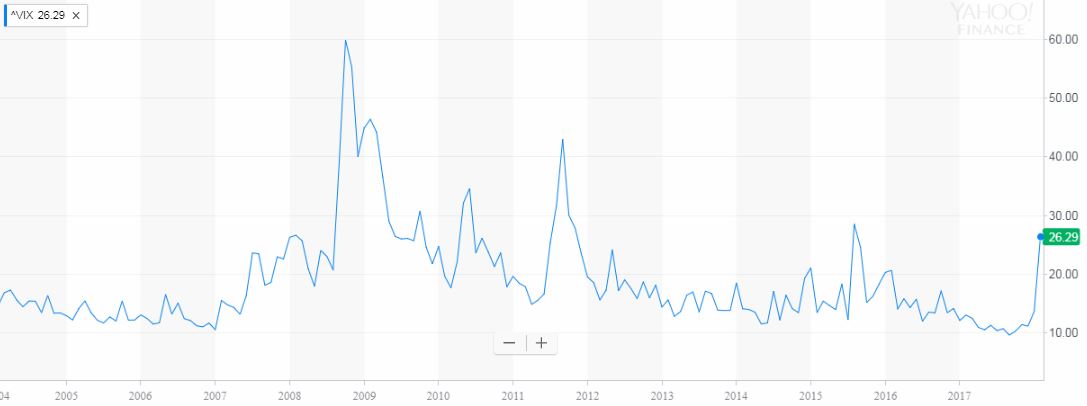
VIX values greater than 30 are generally associated with a large amount of volatility as a result of investor fear or uncertainty, while values below 20 generally correspond to less stressful, even complacent, times in the markets.
In September 2008 the VIX reached 59.89
In August 2011 the VIX reached 42.96
Since February 5th 2017 the VIX has been below 20 until February 5th 2018 when it jumped to 37.32 (30 is high volatility).
The VIX Index moves up and down very quickly so it’s not practical to use this as a buy or sell signal. However. its an indicator of perceived volatility.
To view the VIX chart visit www.bloomberg.com/quote/VIX:IND
To learn more about the VIX visit https://en.wikipedia.org/wiki/VIX
Chart source Yahoo Finance: